What you’ll learn
- How to go from a
dagittyDAG + formula to a compact report - How to interpret the report, and what the variable categories and comparison models mean
- How to export to
LaTeX/Word/Excel/text
Generate a console report with DAGassist
See the Getting Started vignette for a guide on using different parameters get the most out of DAGassist. For the purpose of this tutorial, we will keep it simple.
See the Supported
Models vignette for documentation on what engines
DAGassist supports. Since DAGassist is
model-agnostic, if an engine accepts a standard
formula + data interface, it will usually work.
Interpreting the output:
-
ROLES:
DAGassistclassifies the variables in your formula by causal role, based on the relationships in your DAG. It classifies according to these categories.-
X is the
treatment/independent variable/exposure. -
Y is the
outcome/dependent variable. -
conf stands for
confounder, a common cause of X and Y. Confounders create a spurious association between X and Y, and must be adjusted for. -
med stands for
mediator, a variable that lies on a path from X to Y, which transmit some of the effect from X to Y. One should not adjust for mediators if one wants to estimate the total effect of X on Y. -
col stands for
collider, a direct common descendant of X and Y. Colliders already block paths, so adjusting for it opens a spurious association between X and Y. -
IO stands for
intermediate outcome, a descendant of Y, which introduces bias if adjusted for. -
dMed / Dmediator stands for
descendant of a mediator, which should not be adjusted for when estimating total effect. -
dCol / Dcollider stands for
descendant of a collider. Adjusting for a descendant of a collider opens a spurious association between X and Y. -
other variables, such as those that only affect the
outcome, do not fit any of the previous definitions. They are included
in the canonical model because they can be safely included as controls,
but are omitted from the minimal model because their inclusion is not
strictly necessary. Since
othervariables’ effects are generally neutral, it is usually best to use the minimal adjustment set as your baseline model.
-
X is the
- MODEL COMPARISON:
-
Minimalis the smallest adjustment set necessary to close all back-door paths from the independent to the dependent variable. The minimal set only includesconfoundersas controls. -
Canonicalis the largest permissible adjustment set. Essentially, thecanonicalset contains all control variables that are notconfounders,mediators,intermediate outcomes,descendants of mediatiors, ordescendants of colliders.
DAGassist(
  dag = dag_model,
  formula = lm(Y ~ X + M + Z + A, data = df)
)
#> DAGassist Report:
#>
#> Roles:
#> variable  role        Exp.  Out.  conf  med  col  dOut  dMed  dCol  dConfOn  dConfOff  NCT  NCO
#> X         exposure    x
#> Y         outcome           x
#> Z         confounder              x
#> M         mediator                      x
#> A         nco                                                                               x
#>
#>  (!) Bad controls in your formula: {M}
#> Minimal controls 1: {Z}
#> Canonical controls: {A, Z}
#>
#> Formulas:
#>   original:  Y ~ X + M + Z + A
#>
#> Model comparison:
#>
#> +----------+----------+-----------+-----------+
#> |          | Original | Minimal 1 | Canonical |
#> +==========+==========+===========+===========+
#> | X        | 1.063*** | 1.056***  | 1.056***  |
#> +----------+----------+-----------+-----------+
#> |          | (0.051)  | (0.046)   | (0.046)   |
#> +----------+----------+-----------+-----------+
#> | M        | -0.015   |           |           |
#> +----------+----------+-----------+-----------+
#> |          | (0.047)  |           |           |
#> +----------+----------+-----------+-----------+
#> | Z        | 0.456*** | 0.451***  | 0.451***  |
#> +----------+----------+-----------+-----------+
#> |          | (0.055)  | (0.053)   | (0.053)   |
#> +----------+----------+-----------+-----------+
#> | A        | 0.007    |           | 0.007     |
#> +----------+----------+-----------+-----------+
#> |          | (0.046)  |           | (0.046)   |
#> +----------+----------+-----------+-----------+
#> | Num.Obs. | 500      | 500       | 500       |
#> +----------+----------+-----------+-----------+
#> | R2       | 0.714    | 0.714     | 0.714     |
#> +==========+==========+===========+===========+
#> | + p < 0.1, * p < 0.05, ** p < 0.01, *** p   |
#> | < 0.001                                     |
#> +==========+==========+===========+===========+
#>
#> Roles legend: Exp. = exposure; Out. = outcome; CON = confounder; MED = mediator; COL = collider; dOut = descendant of outcome; dMed  = descendant of mediator; dCol = descendant of collider; dConfOn = descendant of a confounder on a back-door path; dConfOff = descendant of a confounder off a back-door path; NCT = neutral control on treatment; NCO = neutral control on outcome
Exporting
See the Making
Reports vignette for more detailed information on producing
publication-quality DAGassist reports in
LaTex, Word, Excel, and
plaintext.
Since DAGassist is designed to make appendix robustness
checks, this is an example of how to output a report in
LaTeX.
#initialize a temporary path
out_tex <- file.path(tempdir(), "dagassist_report.tex")
DAGassist(
dag = dag_model,
formula = lm(Y ~ X + M + Z + A, data = df),
type = "latex",
out = out_tex) #put your output directory and file name here
cat(readLines(out_tex, n = 15), sep = "\n") # briefly show the output
#> % --------------------- DAGassist LaTeX fragment ---------------------
#> % Requires: \usepackage{tabularray} \UseTblrLibrary{booktabs,siunitx,talltblr}
#> \begingroup\footnotesize
#> \begingroup\setlength{\emergencystretch}{3em}
#> % needs \usepackage{graphicx} for \rotatebox
#> \begin{longtblr}[presep=0pt, postsep=0pt, caption={DAGassist Report:}, label={tab:dagassist}]%
#> {width=\textwidth,colsep=1.5pt,rowsep=0pt,abovesep=0pt,belowsep=0pt,column{3}={colsep=6pt},colspec={X[35,l]X[15,l]X[8,c]X[8,c]X[8,c]X[8,c]X[8,c]X[8,c]X[8,c]X[8,c]X[8,c]X[8,c]X[8,c]X[8,c]}}
#> \toprule
#> Variable & Role & \rotatebox[origin=c]{60}{Exp.} & \rotatebox[origin=c]{60}{Out.} & \rotatebox[origin=c]{60}{CON} & \rotatebox[origin=c]{60}{MED} & \rotatebox[origin=c]{60}{COL} & \rotatebox[origin=c]{60}{dOut} & \rotatebox[origin=c]{60}{dMed} & \rotatebox[origin=c]{60}{dCol} & \rotatebox[origin=c]{60}{dConfOn} & \rotatebox[origin=c]{60}{dConfOff} & \rotatebox[origin=c]{60}{NCT} & \rotatebox[origin=c]{60}{NCO} \\
#> \midrule
#> A & nco & & & & & & & & & & & & x \\
#> M & mediator & & & & x & & & & & & & & \\
#> X & exposure & x & & & & & & & & & & & \\
#> Y & outcome & & x & & & & & & & & & & \\
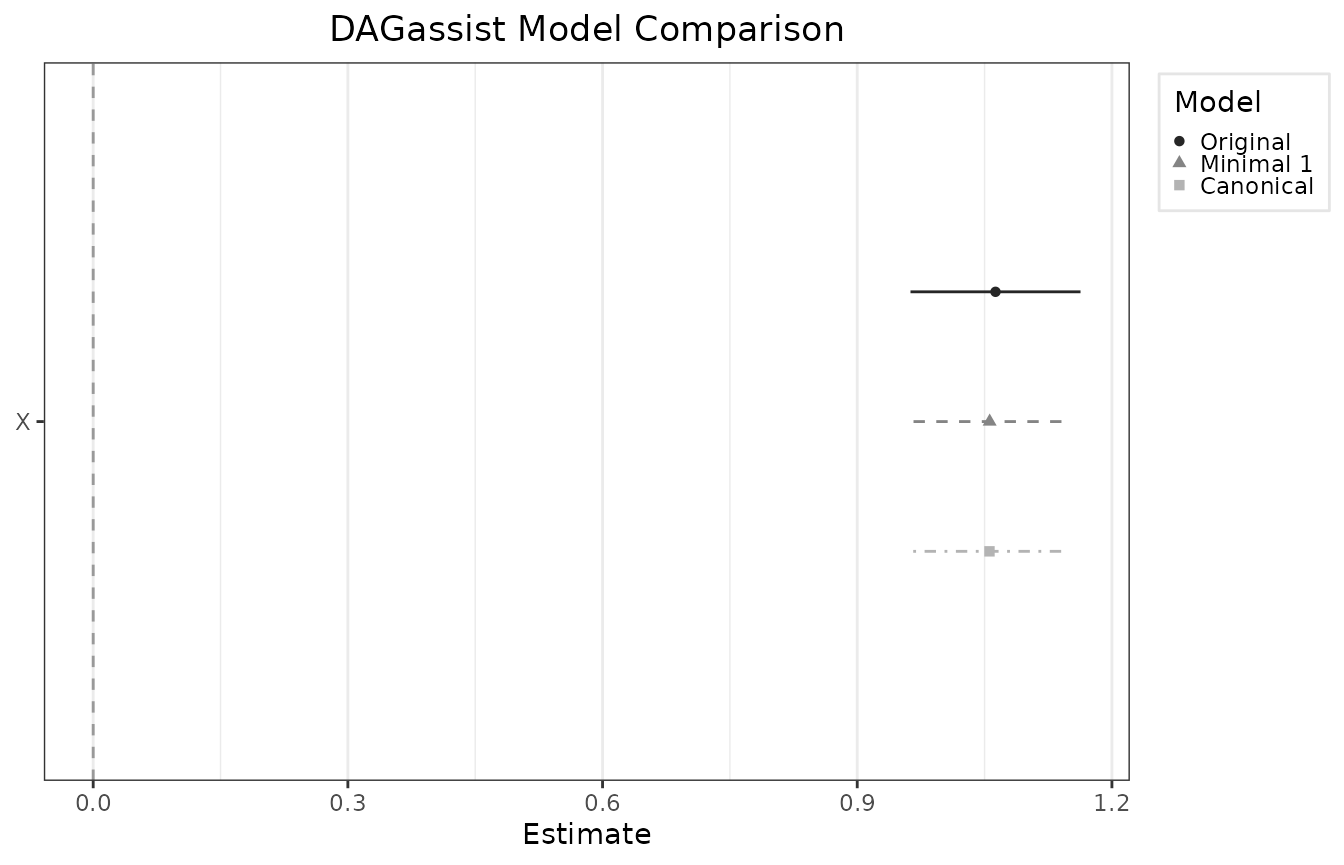
#> Z & confounder & & & x & & & & & & & & & \\Optionally, users can generate visual output via dotwhisker plots: