![]()
![]()
![]()
An all-in-one DAG-driven robustness check. Generate publication-quality reports that classify variables by causal role, compare the significance of DAG-derived models, and explicitly target estimands.
What DAGassist does:
- Classifies covariates by causal role (confounder, mediator, collider, descendants, neutral controls, etc.).
- Automates the reestimation of models using DAG-derived adjustment sets.
- Targets explicit estimands to facilitate transparent comparison between models.
- Produces publication-grade reports in multiple formats (LaTeX/Word/Excel/markdown/plain text + dotwhisker).
- Provides weight diagnostics to evaluate positivity and effective sample sizes.
Installation
You can install DAGassist with:
Or you can install the development version from GitHub with:
# install.packages("devtools")
devtools::install_github("grahamgoff/DAGassist")
Example
Simply provide a dagitty() object and a regression call and DAGassist will create a report classifying variables by causal role, and compare the specified regression to minimal and canonical models.
DAGassist(dag = dag_model,
formula = lm(Y ~ X + M + C + Z + A + B, data = df),
estimand = c("SATE", "SACDE")
)
#> DAGassist Report:
#>
#> Roles:
#> variable role Exp. Out. conf med col dOut dMed dCol dConfOn dConfOff NCT NCO
#> X exposure x
#> Y outcome x
#> Z confounder x
#> M mediator x
#> C collider x x x
#> A nco x
#> B nco x
#>
#> (!) Bad controls in your formula: {M, C}
#> Minimal controls 1: {Z}
#> Canonical controls: {A, B, Z}
#>
#> Formulas:
#> original: Y ~ X + M + C + Z + A + B
#>
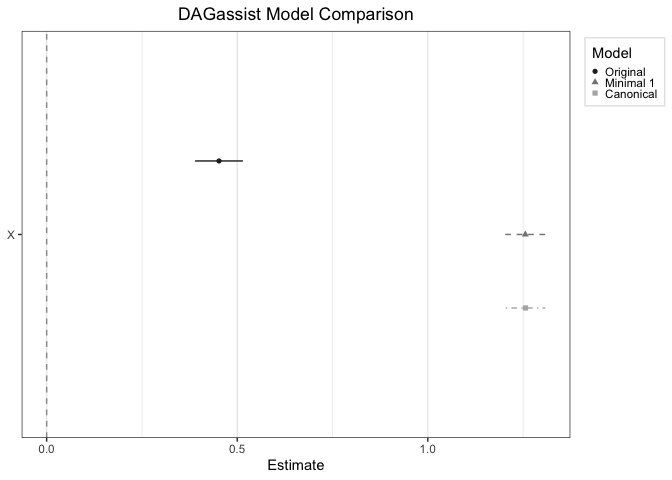
#> Model comparison:
#>
#> +----------+-----------+-----------+------------------+-----------+------------------+-------------+------------------+
#> | | Original | Minimal 1 | Minimal 1 (SATE) | Canonical | Canonical (SATE) | Raw (SACDE) | Weighted (SACDE) |
#> +==========+===========+===========+==================+===========+==================+=============+==================+
#> | X | 0.452*** | 1.256*** | 1.084*** | 1.256*** | 1.097*** | 0.719*** | 0.620*** |
#> +----------+-----------+-----------+------------------+-----------+------------------+-------------+------------------+
#> | | (0.032) | (0.027) | (0.018) | (0.026) | (0.018) | (0.023) | (0.037) |
#> +----------+-----------+-----------+------------------+-----------+------------------+-------------+------------------+
#> | M | 0.514*** | | | | | | |
#> +----------+-----------+-----------+------------------+-----------+------------------+-------------+------------------+
#> | | (0.021) | | | | | | |
#> +----------+-----------+-----------+------------------+-----------+------------------+-------------+------------------+
#> | C | 0.343*** | | | | | | |
#> +----------+-----------+-----------+------------------+-----------+------------------+-------------+------------------+
#> | | (0.019) | | | | | | |
#> +----------+-----------+-----------+------------------+-----------+------------------+-------------+------------------+
#> | Z | 0.249*** | 0.311*** | | 0.309*** | | 0.294*** | 0.440*** |
#> +----------+-----------+-----------+------------------+-----------+------------------+-------------+------------------+
#> | | (0.027) | (0.034) | | (0.033) | | (0.029) | (0.043) |
#> +----------+-----------+-----------+------------------+-----------+------------------+-------------+------------------+
#> | A | 0.152*** | | | 0.187*** | | 0.180*** | 0.188*** |
#> +----------+-----------+-----------+------------------+-----------+------------------+-------------+------------------+
#> | | (0.021) | | | (0.026) | | (0.023) | (0.036) |
#> +----------+-----------+-----------+------------------+-----------+------------------+-------------+------------------+
#> | B | -0.069*** | | | -0.057* | | -0.078*** | -0.099** |
#> +----------+-----------+-----------+------------------+-----------+------------------+-------------+------------------+
#> | | (0.021) | | | (0.026) | | (0.023) | (0.038) |
#> +----------+-----------+-----------+------------------+-----------+------------------+-------------+------------------+
#> | Num.Obs. | 2000 | 2000 | 2000 | 2000 | 2000 | 2000 | 2000 |
#> +----------+-----------+-----------+------------------+-----------+------------------+-------------+------------------+
#> | R2 | 0.818 | 0.706 | 0.655 | 0.714 | 0.664 | | |
#> +==========+===========+===========+==================+===========+==================+=============+==================+
#> | + p < 0.1, * p < 0.05, ** p < 0.01, *** p < 0.001 |
#> +==========+===========+===========+==================+===========+==================+=============+==================+
#>
#> Weight diagnostics:
#> legend: w range reports the min-max weights by group; ESS is kish effective sample size.
#> Minimal 1 (SATE): w range=0.024..371.8 | ESS (weighted)=56.15 [LOW_ESS,EXTREME_W]
#> Canonical (SATE): w range=0.02283..339.7 | ESS (weighted)=64.48 [LOW_ESS,EXTREME_W]
#>
#> Roles legend: Exp. = exposure; Out. = outcome; CON = confounder; MED = mediator; COL = collider; dOut = descendant of outcome; dMed = descendant of mediator; dCol = descendant of collider; dConfOn = descendant of a confounder on a back-door path; dConfOff = descendant of a confounder off a back-door path; NCT = neutral control on treatment; NCO = neutral control on outcomeOptionally, users can generate visual output via dotwhisker plots: